
About Me
Hello,
I'm Fares!
Computer Engineering graduate specializing in Data
Analytics and Business Intelligence.
My academic foundation in Database Systems and
Data Modeling has equipped me with a strong analytical mindset and a structured approach to problem-solving.
I focus on transforming raw, unstructured data into actionable insights that drive
informed business decisions. My work spans the full analytics lifecycle — from
data cleaning and modeling to
KPI development,
performance analysis, and strategic recommendations.
My Skills
Technologies and tools I work with.
Data Analytics
Tools & Technologies
Analytics Projects
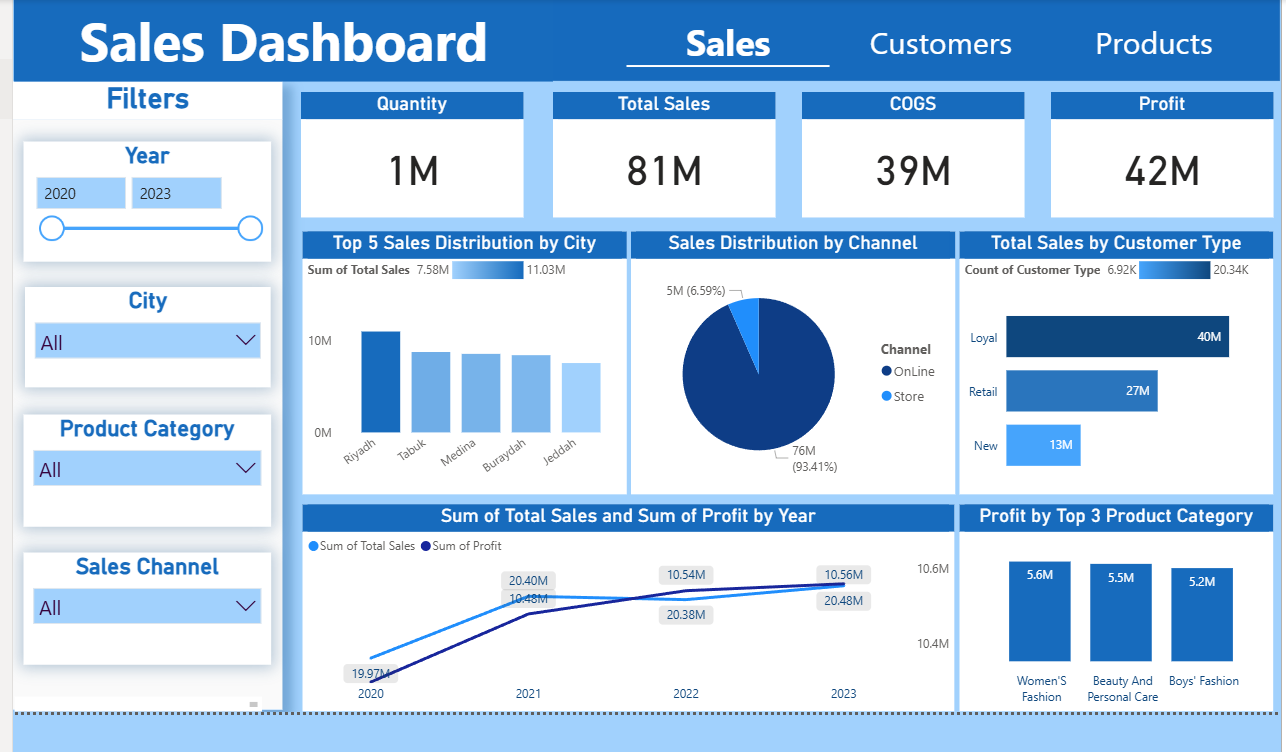
Retail Analytics & Profitability Insights
Analyzed a large retail dataset to uncover key revenue drivers, identify channel dependency risks (93% online sales), and highlight top-performing product categories to support data-driven decision-making.
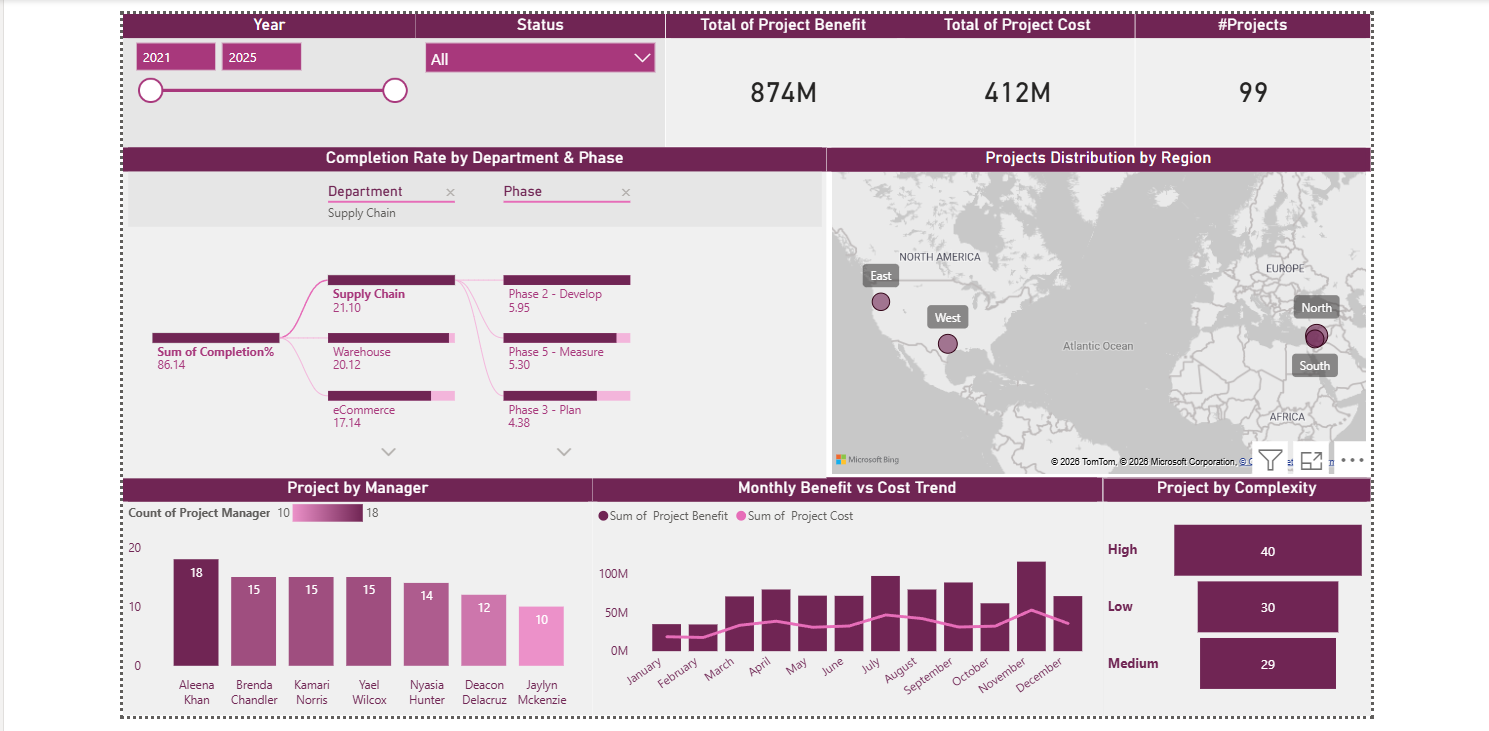
Project Performance & Strategic Analysis
Developed an interactive dashboard to monitor project cost, benefit, and completion status, identifying inefficiencies and supporting better strategic planning across departments.
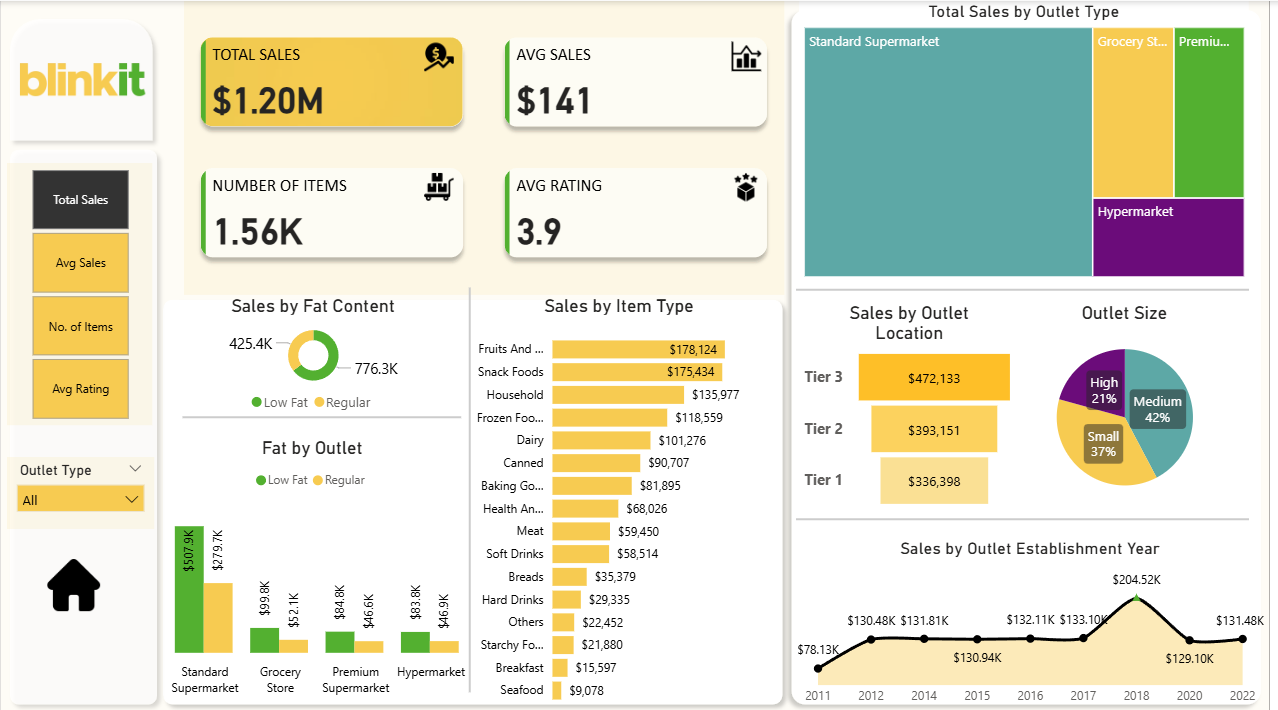
Blinkit Sales & Outlet Performance Dashboard
Designed an interactive Power BI dashboard to analyze Blinkit’s sales performance across product categories, fat content, outlet size, outlet location tier, and outlet type. The dashboard highlights key KPIs, product performance, and branch-level insights to support data-driven business decisions and expansion planning.
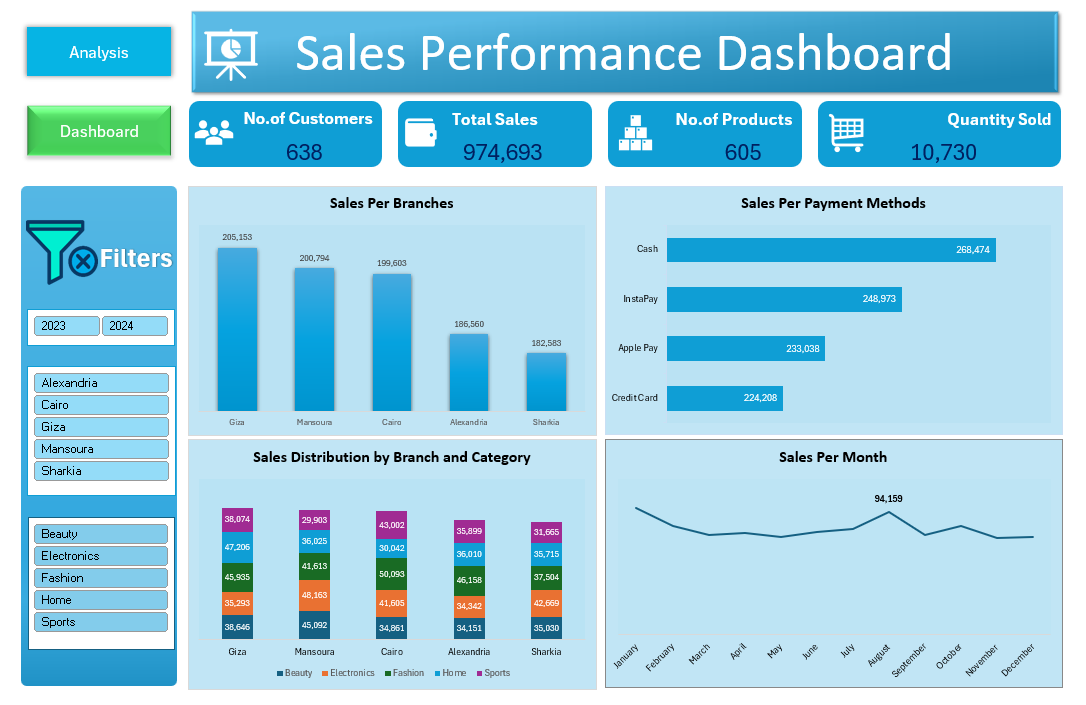
Sales Performance Dashboard
Developed an interactive Excel dashboard to analyze sales performance across branches, brands, product categories, payment methods, and monthly trends. Built a relational data model and interactive reports to track key KPIs, uncover business insights, and support data-driven decision-making through dynamic filtering and visual analysis.